After completing this lesson, you’ll be able to:
A colleague is working on a workspace to calculate the tsunami flood risk for all addresses in the city. The flood risk score combines closeness to the shoreline and elevation above sea level. It is on a scale from one to five (1-5) and is calculated using this table:
| Elevation (meters above sea level) | ||||
| 0-10m | 10-25m | 25-60m | ||
| Distance from Shoreline (meters) | 100m | 1 | 2 | 3 |
| 200m | 2 | 3 | 4 | |
| 300m | 3 | 4 | 5 | |
Your colleague has created the workspace up until the point at which each address has an elevation and distance from the shoreline. Now, the calculations need to start, and he has asked for your help finishing the project.
1) Start Workbench
Open the starting workspace (C:\FMEData\Workspaces\TransformAttributes\exercise-flood-risk-project.fmw). This is the workspace as your colleague has created it so far.
Turn on feature caching and run the workspace. Inspect all three CoastalZones [GML] reader feature type caches and the AttributeRenamer's Output cache (Ctrl or ⌘-click) to observe the data.
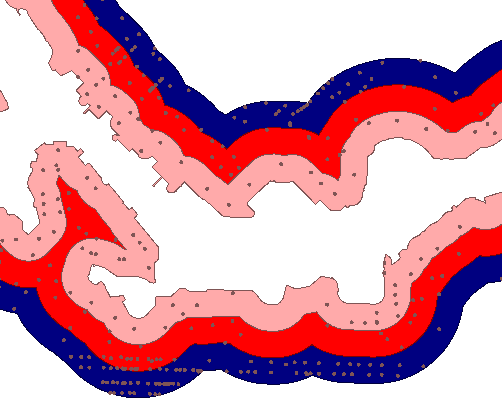
This colored screenshot shows how the addresses fall within (and are assigned) a zone denoting their distance from the shoreline. They also possess an elevation value. We must now use this information to assign a flood risk to each address.
As with most FME projects, there are multiple ways to carry out this task. The two primary techniques are conditional filtering and data mapping.
Conditional filtering means separating the data according to the elevation and shoreline zone. Data mapping means we set an attribute value (flood risk) according to the value of other attributes.
Here is an example of how we might mix filtering data by coastal zone with mapping data by elevation:
However, we can avoid filtering data by using Conditional Values. The filter conditions are incorporated as the conditions for our Conditional Values.
2) Finish Configuring AttributeManager
There is an AttributeManager included in the starting workspace after the AttributeRenamer.
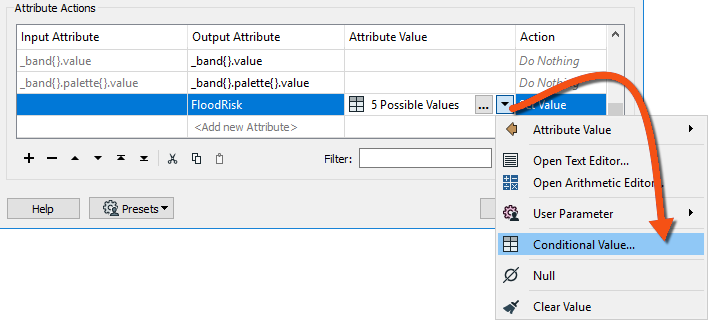
Inspect the AttributeManager parameters. Ignoring the existing attributes, scroll to the bottom of the dialog, and find the FloodRisk attribute.
It already has a conditional value configured, but we need to finish it. In the Attribute Value field, click the drop-down arrow and choose Conditional Value:
This opens a new dialog very similar to a Tester/TestFilter transformer. There are fields for Test Condition and Output Value.
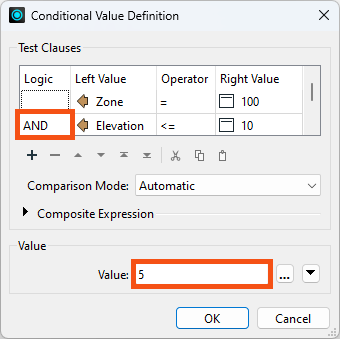
The dialog is already configured to map the conditions for where FloodRisk=1 (the highest). According to the table of calculations, this can occur only when Zone=100 and Elevation<=10 by testing for Zone = 100 AND Elevation <= 10. Notice that the Test uses the booleon operator AND to ensure both conditions are true:
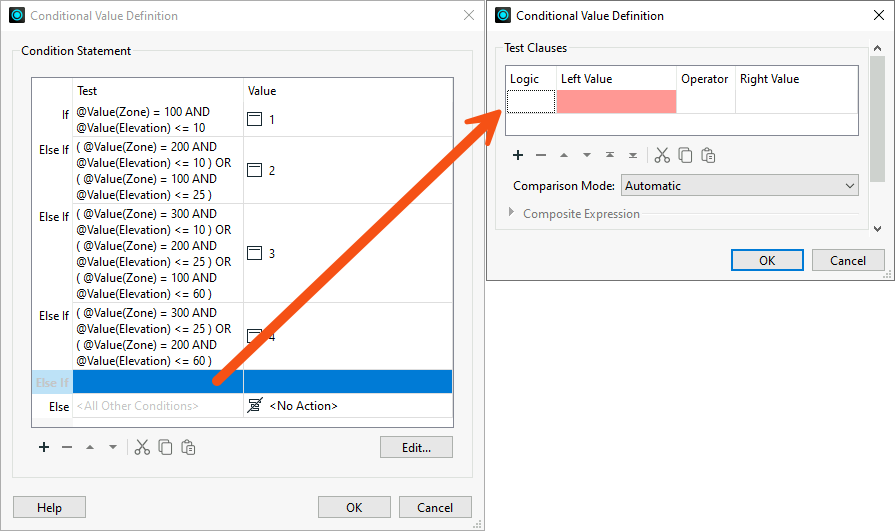
Double-click the cell in the Test Condition column to the right of the gray Else If text to open a Tester-like dialog :
Enter 5 into the Attribute Value parameter at the foot of the dialog:
Now click OK to close this part of the dialog.
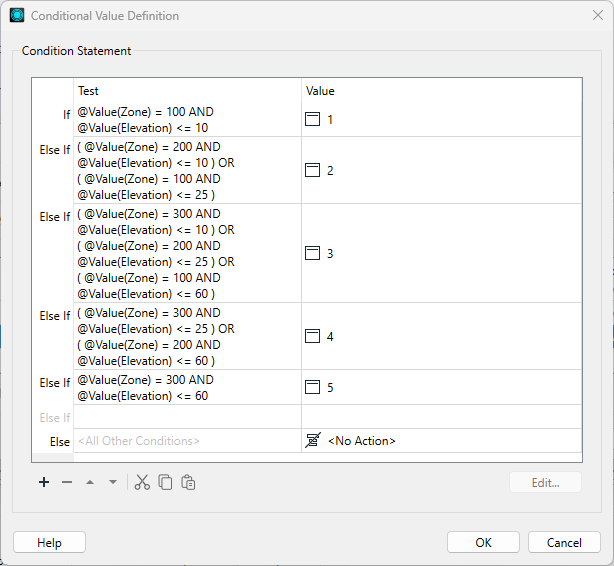
The main Conditional Definition dialog is complete. It should look like this:
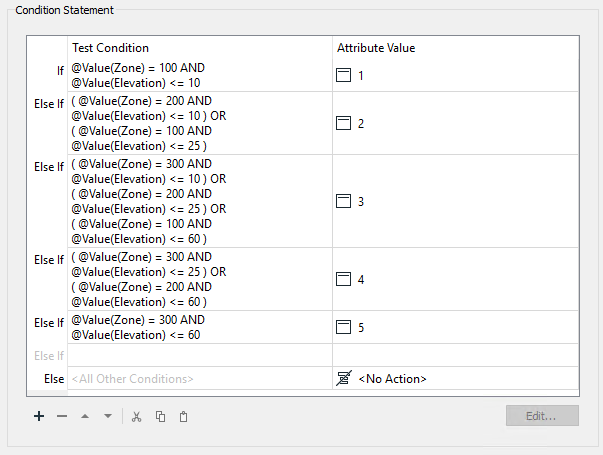
It is essential to keep these in the correct order; otherwise, a feature may pass the tests in the wrong order and receive a lesser risk than expected.
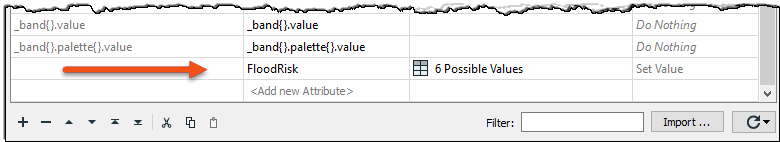
Accept the changes, and the main AttributeManager dialog now looks like this:
5) Add Inspector
Inspecting cached data doesn't allow you to separate that data for easier inspection unless you use an Inspector transformer. So, place a single Inspector transformer and connect the AttributeManager output.
Open the Inspector parameters dialog, check Group Processing and set Group-By to the newly created attribute called FloodRisk.
Save and run the workspace. You should see each address colored to match its flood risk. You can adjust the feature symbology to produce a better result, like so:
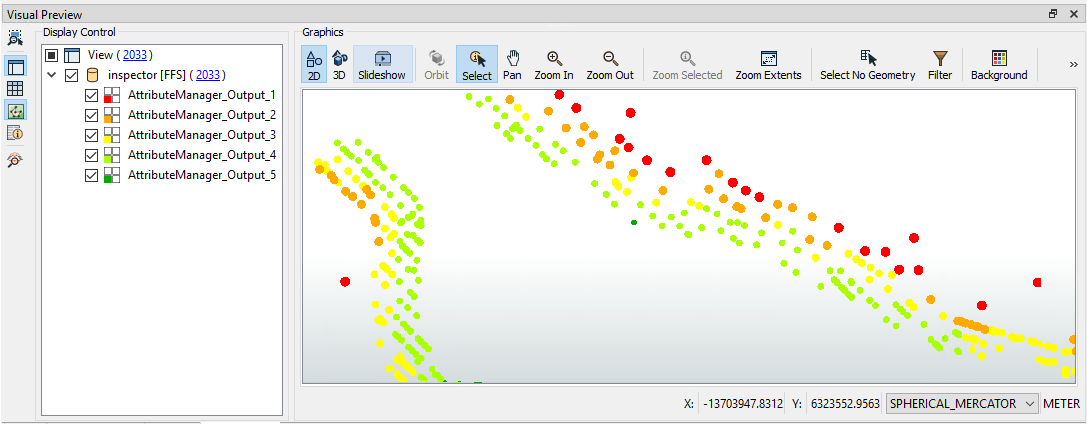
You can also turn off each zone to see which addresses are most/least at risk.
Best practice should always play a part in any workspace. There are fewer transformers in this case, but does this improve the workspace? Is it a more aesthetic (good-looking) workspace? The decision on which method to use may depend on who will maintain the workspace. In most cases, conditional filters or data mapping are both valid options.

